
Data Science Interview Questions

- What is Data Science?
- How does Data Analytics differ from Data Science?
- What are the key differences between supervised and unsupervised learning?
- What steps do you take to maintain a deployed machine learning model?
- What is a Confusion Matrix, and how is it used?
- What are some common techniques used for data sampling?
- What are the main distinctions between supervised and unsupervised learning algorithms?
- What are some strategies to avoid overfitting in a machine learning model?
- How can you calculate the Euclidean distance between two points using Python?
- What is dimensionality reduction, and what are its benefits in data science?
- What is the role of the p-value in hypothesis testing?
- What methods can be used to treat outlier values in a dataset?
- How do you determine if time-series data is stationary?
- How can you calculate model accuracy using a confusion matrix?
- How would you calculate precision and recall using a confusion matrix?
- What is a Confusion Matrix, and why is it important in evaluating classification models?
- How does Data Science differ from traditional application programming?
- What is the difference between long format data and wide format data?
- What are some popular techniques used for data sampling?
- Why is Python commonly used for data cleaning in Data Science?
- How is information gain used in decision tree algorithms?
- Explain what a recurrent neural network (RNN) is and its applications.
- Describe the process of building a decision tree.
- What is the purpose of A/B Testing in data analysis?
- What are the main drawbacks of using a linear model?
- What is survivorship bias, and how can it distort findings?
- How is a random forest constructed, and what are its advantages?
- Why is R widely used for data visualization in Data Science?
- Why do you think Data Science has gained so much popularity today?
- Do you contribute to any open-source projects? If so, which ones and why?
Data science interviews can be tough. They cover many topics like statistics, programming, and machine learning. If you’re new to the field, preparing can feel overwhelming. Even if you have experience, these interviews still require careful practice. The key is understanding the main ideas and common questions. Interviewers want to see how you solve problems and use your skills in real-world situations.
These questions test both your knowledge and how you apply it. You may face coding tasks in Python or R. You might also need to explain how a model works or solve a business problem. Companies want you to explain why you choose certain methods. To help you feel ready, we will explore common questions in machine learning, data handling, and more.
Curious about Data Science and how it can transform your career? Join our free demo at CRS Info Solutions and connect with our expert instructors to learn more about our Data Science online course. We emphasize real-time project-based learning, daily notes, and interview questions to ensure you gain practical experience. Enroll today for your free demo and embark on your path to becoming an AI professional!

1. What is Data Science?

Data Science is a multidisciplinary field that involves using various techniques, algorithms, and systems to extract insights and knowledge from structured and unstructured data. It combines elements of statistics, mathematics, computer science, and domain expertise to analyze vast datasets, identifying patterns, trends, and relationships. The ultimate goal of data science is to turn raw data into meaningful insights that can drive decision-making in business, research, and other fields. As a data scientist, I often find myself diving deep into data, cleaning it, exploring it, and building models that can make accurate predictions or provide actionable insights.
The Data Science process involves several steps: data collection, data cleaning, exploratory data analysis (EDA), model building, and finally, model evaluation and deployment. This process is iterative, meaning that once a model is deployed, I constantly refine and update it based on new data and insights. It’s fascinating how data science allows me to solve real-world problems using numbers, logic, and creativity.
Read more: Data Science Interview Questions Faang
2. How does Data Analytics differ from Data Science?

| Data Analyst | Data Scientist |
|---|---|
| Analyzes and interprets data to help businesses make decisions | Develops and uses complex algorithms and models to predict outcomes |
| Strong in SQL, Excel, data visualization, and basic statistics | Proficient in machine learning, advanced statistics, and programming |
| Primarily uses Excel, SQL, Tableau, Power BI | Uses Python, R, Hadoop, Spark, and machine learning libraries |
| Focuses on analyzing historical data and trends | Focuses on predictive modeling and extracting insights from big data |
| Typically has a background in statistics, business, or economics | Often has a background in computer science, mathematics, or engineering |
Data Analytics focuses on analyzing existing data to identify trends, patterns, and relationships, whereas Data Science is a broader field that encompasses the entire process of extracting insights, building predictive models, and applying machine learning algorithms. While data analytics is about understanding what the data is telling us right now, data science often takes it a step further by using that data to predict future outcomes or to build systems that can learn from data over time. In my experience, data analytics involves more reporting and descriptive analysis, while data science often involves creating and deploying complex models.
For example, in a retail company, a data analyst might look at past sales data to identify which products sold the most in the previous quarter. On the other hand, a data scientist would use that data to build a predictive model that forecasts future sales or customer behavior. So, while both fields deal with data, Data Analytics is more focused on extracting insights from existing data, while Data Science combines analytics with machine learning and other advanced techniques.
3. What are the key differences between supervised and unsupervised learning?
Supervised Learning and Unsupervised Learning are two fundamental types of machine learning techniques, and they differ mainly in how they handle data. In Supervised Learning, I work with labeled data, which means I have a dataset with input-output pairs. The goal is to train a model that can learn the mapping between the input and the output, so when new data is introduced, it can predict the outcome accurately. For example, if I want to predict house prices, I would use historical data with features like the size of the house, number of bedrooms, and the actual sale price to train my model. Once trained, the model can predict the sale price of a new house based on its features.
In contrast, Unsupervised Learning deals with unlabeled data. Here, I don’t have predefined output labels; instead, the model tries to find hidden patterns or structures within the data. A typical use case is clustering, where data points are grouped into clusters based on similarity. For instance, if I have a dataset of customer purchase behaviors, unsupervised learning can help segment customers into different groups based on their buying patterns. This helps businesses tailor marketing strategies to different customer segments. The main difference, therefore, lies in the availability of labeled data and the specific goals of each technique.
Read more: Google Data Scientist Interview Questions
4. Can you explain the steps involved in building a decision tree?
Building a Decision Tree is an essential task in data science, and it involves several steps. First, I start by selecting the best feature from the dataset to split the data. This selection is typically done using metrics like Gini impurity or information gain. These metrics measure how well a feature divides the data into distinct classes. The feature with the highest information gain is chosen as the root of the tree. Next, I split the dataset into subsets based on the selected feature’s values, creating branches for the decision tree.
Once I have the initial split, I repeat the process for each subset, choosing the next best feature and creating further branches. This process continues until all data points are classified, or a stopping criterion is met, such as a maximum depth or a minimum number of data points in a node. A decision tree can handle both categorical and numerical data, making it versatile in handling various data science problems.
For example, let’s say I’m building a decision tree to predict whether a customer will buy a product based on features like age, income, and shopping history. The algorithm selects the feature with the highest predictive power (e.g., income), splits the dataset, and continues this process recursively until the tree can make predictions for all customers. Here’s a simplified Python code snippet to illustrate building a decision tree using the scikit-learn library:
from sklearn.tree import DecisionTreeClassifier

# Sample dataset
X = [[25, 50000], [35, 60000], [45, 80000], [30, 55000]]
y = [0, 1, 1, 0]  # 0 = No Purchase, 1 = Purchase

# Initialize the Decision Tree model
model = DecisionTreeClassifier()

# Fit the model with data
model.fit(X, y)

# Make a prediction
prediction = model.predict([[40, 70000]])
print(prediction)  # Output: [1]
In this example, the model learns from age and income data to predict whether a customer will make a purchase. Decision trees are highly interpretable, but they can overfit the data, which is why techniques like pruning are often used to enhance their performance.
Read more: Basic Artificial Intelligence interview questions and answers
5. How would you differentiate between univariate, bivariate, and multivariate analysis?
Univariate analysis involves analyzing a single variable to understand its distribution, central tendency, and dispersion. I typically use this technique to gain insights into a dataset by looking at metrics such as mean, median, mode, range, and standard deviation. For example, if I’m analyzing the salaries of employees, I would use univariate analysis to determine the average salary, identify the most common salary range, or understand the spread of the salary data.
Bivariate analysis, on the other hand, explores the relationship between two variables. It helps me understand how one variable affects or correlates with another. Common techniques include scatter plots, correlation coefficients, and regression analysis. For instance, I might want to analyze the relationship between employees’ experience and their salaries. By plotting these two variables on a scatter plot, I can identify whether there’s a positive, negative, or no correlation between them.
Multivariate analysis extends this concept to more than two variables, allowing me to explore complex relationships and interactions within the data. Techniques such as multiple regression, PCA (Principal Component Analysis), and factor analysis are common for multivariate analysis. For example, if I analyze employees’ salaries based on age, experience, and education level, multivariate analysis helps me understand how these factors collectively influence salary. Each type of analysis provides unique insights, and I often use them together to gain a deeper understanding of the data.
6. What steps do you take to maintain a deployed machine learning model?
Keeping a machine learning model working well is important. First, I check how the model is performing regularly. I look at things like accuracy, precision, and recall to spot any problems. If the model’s performance drops, it means it’s not finding the right patterns anymore. When that happens, I retrain the model with new data to keep it up-to-date.
I also make sure the data going into the model is clean and correct. Bad data can make the model less accurate, so I check for errors or missing values. If the data or business changes, I update the model to keep it useful. I also use version control to track changes, so I can go back to older versions if needed.
7. What is a Confusion Matrix, and how is it used?
A Confusion Matrix is a table used to evaluate the performance of a classification model. It shows the counts of True Positives (TP), True Negatives (TN), False Positives (FP), and False Negatives (FN), giving me a detailed view of how well the model performs. This matrix helps identify not just the accuracy but also the types of errors the model makes. For instance, in a medical diagnosis model, a false negative might mean missing a disease, which can be critical.
The matrix is structured as follows:
- True Positive (TP): Model correctly predicts the positive class.
- True Negative (TN): Model correctly predicts the negative class.
- False Positive (FP): Model incorrectly predicts the positive class.
- False Negative (FN): Model incorrectly predicts the negative class.
Using this information, I calculate metrics like accuracy, precision, recall, and F1-score, which provide a comprehensive understanding of the model’s performance. This detailed breakdown allows me to refine the model, focusing on reducing the most critical errors.
Explore: Microsoft Data Science Interview Questions
8. How is logistic regression performed, and what is its purpose?
Logistic Regression is a supervised learning algorithm used for binary classification tasks. Unlike linear regression, which predicts continuous values, logistic regression predicts the probability of a particular class (0 or 1). The algorithm uses the logistic function (sigmoid) to map predicted values between 0 and 1, making it ideal for tasks like spam detection, credit scoring, or predicting disease presence.
To perform logistic regression, I start by selecting features from the dataset that influence the target variable. Then, I fit a model using a training dataset, where the algorithm learns the optimal weights for each feature. These weights determine the influence of each feature on the prediction. The model outputs probabilities, which I convert into binary predictions using a threshold, usually 0.5. Here’s a simple Python example using scikit-learn:
from sklearn.linear_model import LogisticRegression
X = [[25], [30], [45], [50]]  # Feature: Age
y = [0, 0, 1, 1]  # Target: 0 = No Purchase, 1 = Purchase
model = LogisticRegression()
model.fit(X, y)
prediction = model.predict([[35]])
print(prediction)  # Output: [0]
In this example, logistic regression predicts whether a customer makes a purchase based on age. The purpose of logistic regression is to estimate probabilities that can be converted into binary outcomes, helping in decision-making processes.
9. What does the p-value signify in statistical analysis?
The p-value helps me understand how strong the evidence is against a null hypothesis. It shows the chance of getting my data or something more extreme, if the null hypothesis is true.
A low p-value (0.05 or less) means my data doesn’t fit well with the null hypothesis, so I might reject it. A high p-value (above 0.05) means there isn’t enough proof to reject the null hypothesis. For example, if I test a new marketing strategy, and the p-value is 0.03, I can say the strategy likely affects sales. But remember, the p-value doesn’t show how big the effect is. It just helps decide if the effect exists
10. What are some common techniques used for data sampling?
Data sampling is the process of selecting a subset of data from a larger dataset to analyze patterns and make inferences. The most common techniques I use include:
- Random Sampling: Selecting data points randomly, ensuring that every point has an equal chance of being chosen.
- Stratified Sampling: Dividing the dataset into different strata (groups) and sampling from each stratum proportionally, which is useful when dealing with imbalanced data.
- Systematic Sampling: Selecting every ‘nth’ data point from the dataset.
- Cluster Sampling: Dividing data into clusters and randomly selecting entire clusters for analysis.
- Convenience Sampling: Choosing data points that are easiest to access, though this method can introduce bias.
These techniques help ensure that the sampled data represents the population accurately, reducing biases and improving model reliability.
See also: Basic Artificial Intelligence interview questions and answers
11. What are the main distinctions between supervised and unsupervised learning algorithms?
Supervised learning algorithms require labeled data, where the model learns the relationship between input features and output labels. These algorithms predict outcomes based on the provided training data. Examples include linear regression, logistic regression, and decision trees. For instance, predicting house prices based on features like size and location is a supervised learning problem since I have the actual prices as labels.
In contrast, unsupervised learning algorithms work with unlabeled data, where the model identifies patterns or structures without predefined output labels. Common algorithms include k-means clustering and principal component analysis (PCA). An example is customer segmentation, where I group customers based on purchasing behaviors without having predefined labels. The key distinction lies in the use of labeled versus unlabeled data, making supervised learning suitable for prediction tasks and unsupervised learning ideal for discovering hidden patterns.
12. How do you build a random forest model, and what are its applications?
Building a Random Forest model involves creating multiple decision trees and aggregating their results to make more accurate predictions. The process starts with generating multiple subsets of data using bootstrap sampling (random sampling with replacement). Each subset is used to build an individual decision tree, and each tree learns from a different part of the data, capturing various patterns.
Once the trees are built, I make predictions by taking a majority vote (classification) or averaging (regression) the predictions from all trees. This ensemble approach reduces overfitting and improves generalization. Random Forest models are widely used in applications such as fraud detection, churn prediction, and medical diagnosis due to their robustness and ability to handle large datasets with high-dimensional features.
13. What are some strategies to avoid overfitting in a machine learning model?
Overfitting occurs when a model performs exceptionally well on training data but fails to generalize to new, unseen data. To avoid overfitting, I use the following strategies:
- Cross-Validation: Splitting the data into training and validation sets multiple times to ensure the model performs consistently across different subsets.
- Regularization: Adding a penalty to the model’s complexity using techniques like L1 (Lasso) or L2 (Ridge) regularization.
- Pruning (for decision trees): Cutting off branches that have little importance in making predictions.
- Early Stopping: Halting training when the model’s performance on validation data starts to decline.
- Ensemble Methods: Combining multiple models, such as in Random Forest or Gradient Boosting, to improve generalization.
These techniques help create models that perform well on both training and unseen data.
14. Can you differentiate between univariate, bivariate, and multivariate analysis with examples?
Univariate analysis involves analyzing a single variable, focusing on its central tendency, spread, and distribution. For example, if I’m studying the average salary of employees, I might use metrics like the mean or median.
Bivariate analysis examines the relationship between two variables. For instance, I might analyze the relationship between employees’ years of experience and their salaries using a scatter plot or correlation coefficient.
Multivariate analysis involves studying more than two variables simultaneously to understand their relationships and interactions. An example is analyzing how age, experience, and education level collectively impact employees’ salaries. Each type of analysis provides different insights into the data’s structure.
15. What methods are commonly used for feature selection in machine learning?
Feature selection is crucial in building efficient machine learning models. Some common methods I use include:
- Filter Methods: Using statistical tests like Chi-square or correlation coefficient to identify relevant features.
- Wrapper Methods: Employing algorithms like Recursive Feature Elimination (RFE), which recursively removes less important features.
- Embedded Methods: Incorporating feature selection into model training, such as using Lasso regression which adds a penalty for unnecessary features.
These methods help improve model accuracy, reduce complexity, and speed up training time.
See also: Beginner AI Interview Questions and Answers
16. Write a program that prints numbers from 1 to 50, replacing multiples of 3 with “Fizz,” multiples of 5 with “Buzz,” and multiples of both with “FizzBuzz.”
To tackle this problem, I write a loop that iterates through numbers from 1 to 50. For each number, I check whether it is divisible by 3, 5, or both. If divisible by both, I print “FizzBuzz”; if divisible by only 3, I print “Fizz”; if divisible by 5, I print “Buzz”; otherwise, I print the number itself. Here’s the Python code for this logic:
for num in range(1, 51):
    if num % 3 == 0 and num % 5 == 0:
        print("FizzBuzz")
    elif num % 3 == 0:
        print("Fizz")
    elif num % 5 == 0:
        print("Buzz")
    else:
        print(num)
This program is simple and concise, efficiently handling the required checks using conditional statements. It demonstrates how to handle multiple conditions and output different values based on those conditions.
17. How would you handle a dataset containing more than 30% missing values?
When dealing with a dataset containing over 30% missing values, my first step is to assess whether these missing values have any pattern or are randomly distributed. If the missing data appears in a random pattern, it might be safe to remove or impute them. However, if there’s a pattern, it could indicate an issue worth investigating further.
If removing the rows or columns with missing data is not an option, I consider imputing them. I use techniques like mean/median/mode substitution for numerical data or most frequent value for categorical data. For more advanced imputation, I might employ K-Nearest Neighbors (KNN) or predictive modeling to estimate missing values. However, if over 30% of the data is missing, I carefully weigh the impact of imputation versus potential bias introduced into the analysis.
18. How can you calculate the Euclidean distance between two points using Python?
Euclidean distance is a measure of the straight-line distance between two points in a multi-dimensional space. To calculate this distance in Python, I use the formula:(x2−x1)2+(y2−y1)2(x2−x1)2+(y2−y1)2
Here’s a Python code example that calculates the Euclidean distance between two points:
import math

point1 = (2, 3)
point2 = (5, 7)

distance = math.sqrt((point2[0] - point1[0])**2 + (point2[1] - point1[1])**2)
print("Euclidean Distance:", distance)
This code calculates the Euclidean distance between two points (2, 3) and (5, 7), providing the result as 5.0. The Euclidean distance is widely used in clustering algorithms and K-Nearest Neighbors (KNN) to measure similarity.
See also: Intermediate AI Interview Questions and Answers
19. What is dimensionality reduction, and what are its benefits in data science?
Dimensionality reduction is the process of reducing the number of input variables (features) in a dataset while retaining as much information as possible. It’s essential when dealing with high-dimensional data, as too many features can lead to issues like overfitting, increased computational cost, and the curse of dimensionality.
By applying techniques such as Principal Component Analysis (PCA) or t-SNE (t-Distributed Stochastic Neighbor Embedding), I can project high-dimensional data onto a lower-dimensional space. This not only makes the data easier to visualize and interpret but also improves model performance by reducing noise and computational complexity.
20. How do you calculate eigenvalues and eigenvectors for a given matrix?
Eigenvalues and eigenvectors are fundamental concepts in linear algebra and are crucial for understanding data transformations, especially in Principal Component Analysis (PCA). To calculate them, I solve the equation:

In Python, I can use numpy to compute them:
import numpy as np

matrix = np.array([[4, 2], [1, 3]])
eigenvalues, eigenvectors = np.linalg.eig(matrix)

print("Eigenvalues:", eigenvalues)
print("Eigenvectors:\n", eigenvectors)
This code finds the eigenvalues and eigenvectors for a 2×2 matrix. Understanding these concepts is vital for dimensionality reduction and data transformations in data science.
21. What are recommender systems, and how do they work?
Recommender systems are algorithms that suggest relevant items (products, movies, articles) to users based on their preferences, behavior, or similarity to other users/items. They are widely used in e-commerce, streaming platforms, and social media.
There are two main types of recommender systems:
- Collaborative Filtering: Uses user-item interactions to recommend items based on similar users or items. For example, if two users have a history of similar purchases, the system recommends items one user has bought to the other.
- Content-Based Filtering: Recommends items based on the item’s features and the user’s preferences. For instance, if a user likes action movies, the system recommends more action movies.
These systems often employ a hybrid approach, combining both collaborative and content-based filtering for improved accuracy.
22. How do you calculate RMSE (Root Mean Square Error) and MSE (Mean Square Error) in a linear regression model?
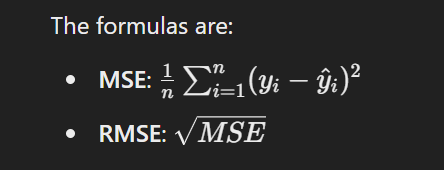
Mean Square Error (MSE) and Root Mean Square Error (RMSE) are metrics used to evaluate the performance of regression models. MSE measures the average squared difference between predicted and actual values, while RMSE is the square root of MSE, providing an error measure in the original units.
Here’s how I calculate them using Python:
import numpy as np

actual = np.array([3, -0.5, 2, 7])
predicted = np.array([2.5, 0.0, 2, 8])

mse = np.mean((actual - predicted) ** 2)
rmse = np.sqrt(mse)

print("MSE:", mse)
print("RMSE:", rmse)
MSE and RMSE help me gauge the accuracy of my model, with lower values indicating better performance.
See also: NLP Interview Questions
23. How do you determine the appropriate value of ‘k’ for k-means clustering?
Selecting the right value of ‘k’ in k-means clustering is crucial for ensuring the model captures the underlying data structure accurately. One common method I use is the Elbow Method, where I plot the Within-Cluster Sum of Squares (WCSS) against different values of ‘k’ and look for the “elbow point,” where adding more clusters results in diminishing returns.
Alternatively, I can use the Silhouette Score, which measures how well-separated the clusters are. A higher silhouette score indicates better-defined clusters, helping me choose the most appropriate ‘k’.
24. What is the role of the p-value in hypothesis testing?
The p-value plays a critical role in hypothesis testing by helping me determine whether to reject the null hypothesis. It represents the probability of obtaining results at least as extreme as the observed data, assuming the null hypothesis is true.
If the p-value is less than a pre-determined significance level (e.g., 0.05), I reject the null hypothesis, indicating that the observed effect is statistically significant. However, if the p-value is greater than 0.05, I fail to reject the null hypothesis, suggesting insufficient evidence to support an alternative claim.
25. What methods can be used to treat outlier values in a dataset?
Handling outliers is essential to ensure that a model is robust and reliable. Some common methods I use include:
- Removing Outliers: If outliers are clearly errors or anomalies, I remove them from the dataset.
- Transformation: Applying transformations like logarithmic or square root can reduce the impact of outliers.
- Capping and Flooring: Limiting extreme values to a certain percentile, such as the 5th and 95th percentiles.
- Imputation: Replacing outliers with the median or mean value.
These techniques help improve model accuracy by minimizing the influence of extreme values.
26. How do you determine if time-series data is stationary?
Stationarity in time-series data means that its statistical properties, like mean, variance, and autocorrelation, remain constant over time. To determine if time-series data is stationary, I use several methods. One common method is the visual inspection of the data plot; if the data shows constant variance and mean over time, it may be stationary.
A more formal approach is using statistical tests such as the Augmented Dickey-Fuller (ADF) test or the Kwiatkowski-Phillips-Schmidt-Shin (KPSS) test. In the ADF test, if the p-value is less than the chosen significance level (e.g., 0.05), the null hypothesis of non-stationarity is rejected, indicating that the data is stationary. If the data isn’t stationary, I apply techniques like differencing or log transformation to make it stationary.
See also: Artificial Intelligence Scenario Based Interview Questions
27. How can you calculate model accuracy using a confusion matrix?
To calculate model accuracy using a Confusion Matrix, I divide the sum of True Positives (TP) and True Negatives (TN) by the total number of observations. The formula is:

This calculation tells me how often the model makes correct predictions. For instance, if I have a confusion matrix where TP = 50, TN = 40, FP = 10, and FN = 5, the accuracy would be:

While accuracy gives a quick performance measure, it can be misleading in imbalanced datasets, where other metrics like precision and recall might be more informative.
28. How would you calculate precision and recall using a confusion matrix?
Precision and Recall are key metrics for evaluating a model, especially in classification tasks. Using a Confusion Matrix, I calculate them as follows:
- Precision: Measures the proportion of correctly predicted positive observations to the total predicted positives. The formula is:

- Recall (Sensitivity or True Positive Rate): Measures the proportion of correctly predicted positive observations to all actual positives. The formula is:

For instance, if TP = 40, FP = 10, and FN = 20, Precision = 40 / (40 + 10) = 0.8 (80%) and Recall = 40 / (40 + 20) = 0.67 (67%). These metrics help evaluate how well my model handles different types of errors.
29. What algorithm is used for generating “People who bought this also bought…” recommendations on e-commerce platforms like Amazon?
Collaborative Filtering is the most common algorithm used for generating “People who bought this also bought…” recommendations. It operates on the principle that users who bought similar items in the past are likely to have similar preferences. Collaborative filtering is divided into two types:
- User-Based: Recommends items based on the preferences of similar users.
- Item-Based: Recommends items similar to the ones a user has already bought.
Item-Based Collaborative Filtering is particularly popular in e-commerce because it scales well with large datasets and effectively captures item-to-item relationships.
30. Write an SQL query to list all orders with customer information, given order and customer tables.
To retrieve all orders along with customer information, I would perform a JOIN between the Orders and Customers tables using a common key (usually CustomerID). Here’s an example SQL query:
SELECT Orders.OrderID, Orders.OrderDate, Customers.CustomerName, Customers.Email
FROM Orders
JOIN Customers ON Orders.CustomerID = Customers.CustomerID;
This query selects the OrderID, OrderDate, CustomerName, and Email for each order, joining the tables based on the CustomerID. This technique ensures that I retrieve relevant details from both tables efficiently.
31. Why might a classification model with 96% accuracy in cancer detection not be ideal? What would you do to improve it?
A 96% accuracy in cancer detection might sound impressive, but it can be misleading, especially in imbalanced datasets where the majority class dominates. For instance, if only 4% of patients have cancer, a model that predicts “no cancer” for everyone will achieve 96% accuracy but fail to detect any actual cases.
To improve it, I would focus on metrics like precision, recall, and F1-score to better understand the model’s ability to detect true positive cases. Techniques like SMOTE (Synthetic Minority Over-sampling Technique) can help balance the dataset, while cost-sensitive learning can make the model more responsive to minority classes.
32. Which machine learning algorithm can handle missing values for both categorical and continuous variables?
The Random Forest algorithm can handle missing values for both categorical and continuous variables effectively. It uses the proximity-based imputation method, which considers the similarity between data points to fill in missing values. Another powerful feature is that Random Forests handle categorical variables without requiring any encoding, making them versatile for real-world datasets.
For example, while building the trees, Random Forest considers data points with missing values as potential matches based on other available features, allowing it to handle incomplete data efficiently.
33. Given the target variable values [0, 0, 0, 1, 1, 1, 1, 1], how would you calculate its entropy?
Entropy measures the level of uncertainty or randomness in a dataset. It’s calculated using the formula:

For the given target values [0, 0, 0, 1, 1, 1, 1, 1], the probability of 0 (p(0)) is 3/8, and the probability of 1 (p(1)) is 5/8. Therefore:

This entropy value indicates the level of impurity in the dataset, guiding decision tree splits.
See also: Core AI interview questions
34. Which algorithm is most suitable for predicting the probability of death from heart disease based on risk factors like age, gender, and cholesterol levels?
Logistic Regression is the most suitable algorithm for predicting the probability of death from heart disease based on risk factors. Since it’s a binary classification problem, logistic regression is ideal for estimating probabilities and modeling the relationship between the dependent variable (death/no death) and independent variables (age, gender, cholesterol levels).
Logistic regression’s output is a probability value, allowing me to interpret the risk factors’ impact and make informed decisions on interventions.
35. Which algorithm would you choose to identify users most similar to four identified individual types in a population study?
I would choose k-Means Clustering to identify users most similar to the four identified individual types in a population study. This unsupervised learning algorithm partitions the data into ‘k’ clusters based on feature similarity, allowing me to group users who exhibit similar characteristics.
Since we are looking for four individual types, I would set k = 4, and the algorithm will group the users into four clusters based on the similarity of their attributes. This technique is widely used for market segmentation, customer profiling, and identifying behavior patterns.
36. What additional insights can be drawn from association rules found in your dataset, such as {banana, apple} => {grape}?
Association rules help identify relationships between items in a dataset, revealing patterns like {banana, apple} => {grape}. From such a rule, I gain insights into customer purchasing behavior, suggesting that those who buy bananas and apples are likely to buy grapes. This insight is valuable for cross-selling, product bundling, or inventory management.
Additionally, I can use metrics like support, confidence, and lift to evaluate the strength of these associations. For example, high confidence in the rule means a strong relationship between the products, helping me design targeted marketing campaigns to increase sales. These rules assist in understanding customer preferences, allowing data-driven strategies.
37. What statistical method would you use to analyze the impact of offering coupons on website visitors’ purchasing decisions?
To analyze the impact of offering coupons on website visitors’ purchasing decisions, I would use an A/B Testing (Hypothesis Testing) approach. This method involves randomly splitting visitors into two groups: one group receives the coupon (treatment group), and the other does not (control group).
By comparing the conversion rates between the two groups using statistical tests like the t-test, I can determine whether the coupon has a statistically significant impact on purchasing decisions. If the p-value is less than 0.05, I conclude that offering coupons positively affects visitor purchases.
38. What do you understand by true positive rate (TPR) and false positive rate (FPR)?
The True Positive Rate (TPR), also known as Recall, measures the proportion of actual positives correctly predicted by the model. It’s calculated as:

For example, if my model predicts 80 out of 100 actual positive cases correctly, the TPR is 0.8 (80%).
The False Positive Rate (FPR) measures the proportion of negative cases incorrectly predicted as positive. It’s calculated as:

If my model incorrectly predicts 20 out of 100 negative cases as positive, the FPR is 0.2 (20%). These metrics help assess the trade-off between correctly identifying positive cases and avoiding false alarms, which is crucial in classification tasks.
See also: Generative AI Interview Questions Part 1
39. What is the ROC curve, and how is it used in binary classification?
The Receiver Operating Characteristic (ROC) curve is a graphical representation of a classification model’s performance. It plots the True Positive Rate (TPR) against the False Positive Rate (FPR) at different probability thresholds. The Area Under the Curve (AUC) measures the model’s overall ability to distinguish between positive and negative classes.
A model with an AUC of 0.5 is equivalent to random guessing, while a model with an AUC closer to 1 is highly effective. I use the ROC curve to visualize how the model’s performance changes with different thresholds, helping me choose an optimal threshold for specific use cases, like maximizing recall in a medical diagnosis.
40. What is a Confusion Matrix, and why is it important in evaluating classification models?
A Confusion Matrix is a table used to evaluate the performance of a classification model. It shows the counts of True Positives (TP), True Negatives (TN), False Positives (FP), and False Negatives (FN), allowing me to understand the types of errors made by the model.
This matrix is important because it provides a comprehensive view of model performance, beyond simple accuracy. It helps calculate other metrics like precision, recall, and F1-score, which offer deeper insights into the model’s strengths and weaknesses, especially in imbalanced datasets where accuracy alone might be misleading.
41. How does Data Science differ from traditional application programming?
Data Science involves extracting insights and building predictive models using data, combining statistics, machine learning, and domain expertise. Unlike traditional application programming, which focuses on building software to perform predefined tasks, data science focuses on uncovering hidden patterns and making data-driven decisions.
In data science, the process is often exploratory, iterative, and involves working with unstructured data, whereas traditional programming follows a structured and rule-based approach. Additionally, data science requires skills in mathematics, data visualization, and machine learning, whereas traditional programming relies more on writing code to implement logic.
42. What is the difference between long format data and wide format data?
Long format data has multiple rows for each subject, with a separate row for each observation or measurement. It’s ideal for time-series data or when dealing with repeated measures. For example, in a dataset tracking monthly sales, each month’s sales data appears in a separate row.
Wide format data, on the other hand, has a single row for each subject, with different columns representing different observations. It’s useful for machine learning models where each feature needs to be in its column. Understanding these formats is essential, as some statistical techniques require data in a specific format for analysis.
43. What are some popular techniques used for data sampling?
Data Sampling is essential for reducing large datasets to manageable sizes while maintaining representativeness. Popular techniques include:
- Random Sampling: Selecting data points randomly, ensuring each has an equal chance of being chosen.
- Stratified Sampling: Dividing data into strata (groups) and sampling proportionally from each group.
- Systematic Sampling: Selecting every ‘nth’ data point from a dataset.
- Cluster Sampling: Dividing the data into clusters and randomly selecting entire clusters for analysis.
These techniques help ensure that the sample accurately reflects the entire population, improving model training efficiency and performance.
44. Why is Python commonly used for data cleaning in Data Science?
Python is widely used for data cleaning due to its powerful libraries like Pandas, NumPy, and Scikit-learn, which offer efficient tools for handling missing values, filtering, transforming data, and detecting outliers. Python’s syntax is easy to read and write, making it accessible for quick data manipulation.
The flexibility to write custom functions and the availability of advanced data cleaning methods, like imputation and data transformation, make Python an ideal choice for preparing data for analysis or model training. This combination of simplicity, versatility, and library support makes Python a go-to language for data cleaning tasks.
45. Which libraries are most popular in Data Science, and what are their uses?
Several libraries stand out in Data Science for their functionality:
- Pandas: Used for data manipulation, cleaning, and analysis, providing easy-to-use data structures like DataFrames.
- NumPy: Offers efficient operations on large multi-dimensional arrays, making it essential for numerical computations.
- Scikit-learn: Provides tools for machine learning, including classification, regression, and clustering algorithms.
- Matplotlib & Seaborn: Used for data visualization, enabling the creation of charts and graphs to understand data patterns.
- TensorFlow & PyTorch: Popular for building deep learning models, offering tools for neural network design and training.
These libraries cover a wide range of tasks, from data preprocessing to advanced machine learning, making them indispensable for data scientists.
See also: Advanced AI Interview Questions and Answers
46. What does variance mean in Data Science, and why is it important?
Variance is a statistical measure that indicates how much the data points in a dataset deviate from the mean or average value. In simpler terms, it shows the degree of spread or dispersion in the data. A high variance means the data points are spread out over a wide range, while a low variance indicates they are closely clustered around the mean.
Variance is important because it helps me understand the data’s variability, which affects model performance. In machine learning, a high variance model may overfit the training data, capturing noise rather than the actual patterns. Understanding variance enables me to build models that generalize well to new, unseen data.
47. What is pruning in a decision tree algorithm, and how does it improve accuracy?
Pruning is a technique used to reduce the size of a decision tree by removing sections that provide little predictive power or contribute to overfitting. When building a decision tree, it’s easy for the model to create complex branches that perfectly fit the training data, but this complexity often reduces its ability to generalize to new data.
Pruning involves two main types: pre-pruning (stopping the tree’s growth early based on a criterion like maximum depth) and post-pruning (trimming branches after the tree is fully grown). By removing unnecessary branches, pruning simplifies the model, improves accuracy on unseen data, and reduces overfitting, making the model more robust.
48. What is entropy in a decision tree algorithm, and why is it significant?
Entropy is a measure of the impurity or uncertainty in a dataset. In a decision tree, entropy helps determine how to split the data at each node, guiding the tree-building process. A dataset with high entropy has a mix of different classes, indicating high disorder, while low entropy suggests that the data is more homogeneous.
By calculating entropy, I identify the best feature to split the data, aiming to reduce entropy and create purer nodes. This process ensures that each decision tree split maximizes information gain, leading to a more efficient model that accurately classifies data points.
49. How is information gain used in decision tree algorithms?
Information gain is a metric used to evaluate the effectiveness of a feature in splitting a dataset into homogeneous subsets. It measures the reduction in entropy achieved by dividing the data based on a specific feature. The higher the information gain, the more effectively that feature separates the data into pure classes.
During the tree-building process, I calculate the information gain for each feature and select the one with the highest gain as the splitting criterion. This approach ensures that each split increases the model’s predictive power, leading to a more accurate and efficient decision tree.
50. What is k-fold cross-validation, and how is it applied in model evaluation?
K-fold cross-validation is a technique used to assess the performance of a machine learning model by dividing the data into k subsets (folds). The model is trained on k-1 folds and tested on the remaining fold, repeating this process k times, with each fold serving as the test set once.
The results from each iteration are averaged to produce an overall performance metric, providing a more reliable and robust evaluation of the model. K-fold cross-validation reduces the risk of overfitting and ensures that the model’s performance is tested across different subsets of data, making it a standard technique for model validation.
51. What is a normal distribution, and how is it relevant to data analysis?
A normal distribution is a bell-shaped probability distribution characterized by its mean, median, and mode being equal. It is symmetric around the mean, and most of the data points lie within one standard deviation from the mean. The properties of normal distribution make it a fundamental concept in statistics and data analysis.
In data science, many statistical tests, such as the t-test and ANOVA, assume that the data follows a normal distribution. Understanding this distribution helps me apply appropriate statistical techniques, draw inferences, and build predictive models based on the data’s properties.
52. What is Deep Learning, and how is it different from traditional machine learning?
Deep Learning is a subset of machine learning that uses multi-layered neural networks to learn complex patterns from data. Unlike traditional machine learning models, which require feature engineering to extract relevant features, deep learning models can automatically learn features from raw data through multiple layers of processing.
The main difference lies in the model’s complexity and ability to handle unstructured data like images, text, and audio. While traditional machine learning models work well with structured data and smaller datasets, deep learning models excel at capturing intricate patterns in large datasets, making them ideal for tasks like image recognition and natural language processing.
53. Explain what a recurrent neural network (RNN) is and its applications.
A Recurrent Neural Network (RNN) is a type of deep learning model designed for sequential data, such as time series, text, or speech. Unlike traditional neural networks, RNNs have a memory that allows them to retain information from previous inputs, making them ideal for tasks that require context or temporal dependencies.
RNNs are widely used in applications like language modeling, speech recognition, sentiment analysis, and machine translation. For instance, in language translation, an RNN can capture the context of previous words to generate accurate translations, making it effective for handling sequences of varying lengths.
54. What are feature vectors, and how are they used in machine learning?
A feature vector is a list or array of numerical values that represent the features of a data point in a machine learning model. Each element in the feature vector corresponds to a specific attribute of the data, making it a crucial input for training and predicting with machine learning algorithms.
For example, in a house price prediction model, a feature vector might include values like the number of bedrooms, square footage, and age of the house. These vectors are fed into machine learning models, enabling them to learn patterns and relationships between features, ultimately making predictions or classifications.
55. Describe the process of building a decision tree.
Building a decision tree involves several steps. First, I start with the root node, which contains the entire dataset. I then select the best feature to split the data based on a metric like information gain or Gini impurity, creating branches for each possible feature value.
This process is recursively repeated for each subset of data until reaching a stopping criterion, such as a maximum depth, minimum samples per leaf, or pure nodes. The resulting tree has branches representing decision rules, and the leaves represent the final predicted classes or outcomes. This structured approach allows decision trees to handle both categorical and numerical data, making them versatile for classification and regression tasks.
56. What is root cause analysis, and where is it commonly applied?
Root Cause Analysis (RCA) is a method used to identify the underlying cause of a problem or issue. Rather than addressing symptoms, RCA focuses on finding the fundamental cause, allowing for more effective and long-term solutions. It’s commonly applied in quality control, incident investigation, and process improvement across various industries.
For example, in manufacturing, RCA can be used to identify why a defect occurs in a product, leading to targeted corrective actions. Similarly, in IT, RCA helps diagnose the root cause of system failures, ensuring that the issue is permanently resolved.
57. What is logistic regression, and in which scenarios is it used?
Logistic Regression is a supervised learning algorithm used for binary classification problems. Unlike linear regression, which predicts continuous values, logistic regression predicts the probability that a given input belongs to a specific class (0 or 1). It uses the sigmoid function to map predicted values between 0 and 1.
This algorithm is commonly used in scenarios like spam detection, customer churn prediction, and disease diagnosis. For example, logistic regression can predict whether an email is spam or not based on features like word frequency, making it a widely used tool in classification tasks.
58. How do recommender systems utilize collaborative filtering?
Collaborative filtering is a technique used in recommender systems to suggest items based on user behavior and preferences. It operates on the principle that users with similar preferences will likely enjoy similar items. There are two main types:
- User-Based Collaborative Filtering: Recommends items by finding users with similar preferences.
- Item-Based Collaborative Filtering: Recommends items that are similar to those the user has liked in the past.
For example, in an e-commerce platform, if two users have a history of buying similar products, collaborative filtering can recommend products that one user has purchased to the other, enhancing the user experience.
59. What is cross-validation, and why is it essential in model evaluation?
Cross-validation is a technique used to assess the performance of a machine learning model by dividing the dataset into multiple subsets. The most common type is k-fold cross-validation, where the data is split into k folds, and the model is trained on k-1 folds and tested on the remaining fold. This process repeats k times, with each fold serving as the test set once.
Cross-validation provides a more reliable estimate of model performance, reducing the risk of overfitting and ensuring that the model generalizes well to new data. It helps me select the best model and hyperparameters, making it a crucial step in model evaluation.
60. Do gradient descent methods always converge to the same points? Why or why not?
Gradient Descent doesn’t always converge to the same point, and this largely depends on factors like the initial starting point, learning rate, and the nature of the loss function. When working with convex functions, gradient descent converges to the global minimum since there’s only one lowest point. However, in non-convex functions with multiple local minima or saddle points, the algorithm might converge to different points based on where I start.
The learning rate also plays a significant role. If it’s too high, the algorithm might overshoot and miss the minimum, while a very low learning rate can result in slow convergence. To address this, I often experiment with different starting points or use optimization techniques like stochastic gradient descent or momentum to improve convergence.
61. What is the purpose of A/B Testing in data analysis?
The primary purpose of A/B Testing is to compare two or more versions of a variable (like a web page design, marketing strategy, or product feature) to determine which one performs better. I conduct an A/B test by splitting my target audience into two groups: Group A (control) and Group B (treatment). Group A experiences the current version, while Group B experiences the modified version.
By analyzing the results, I can statistically determine if the changes lead to a significant improvement in performance metrics such as conversion rates or click-through rates. This helps me make data-driven decisions about which version to implement, ensuring that changes positively impact my goals.
62. What are the main drawbacks of using a linear model?
One main drawback of using a linear model is its assumption of a linear relationship between input features and the target variable. In real-world scenarios, relationships are often non-linear, meaning a linear model might not capture complex patterns accurately. For example, predicting house prices might involve interactions between features like location and size that a linear model cannot fully understand.
Another limitation is that linear models are sensitive to outliers, which can skew results. If an outlier exists in my dataset, the model’s coefficients may be distorted, reducing prediction accuracy. Additionally, linear models struggle with high-dimensional data where multicollinearity (correlated features) can cause instability in coefficient estimation, leading me to prefer more flexible algorithms like decision trees or neural networks.
63. What is the law of large numbers, and how does it apply to data analysis?
The Law of Large Numbers states that as the sample size increases, the sample mean will converge to the population mean. In other words, the more data points I collect, the more accurate and reliable my statistical estimates become. This concept is fundamental in data analysis because it justifies using large samples to draw conclusions about the population.
For example, if I want to estimate the average height of adults, measuring a larger sample size provides a more accurate representation of the true population mean. This principle helps me understand that larger datasets yield more robust insights, reducing the impact of random fluctuations and sampling errors.
64. What are confounding variables, and how do they affect data analysis?
Confounding variables are variables that influence both the independent and dependent variables, creating a false or misleading association between them. When a confounding variable exists, it can distort the true relationship between the variables I’m interested in analyzing, leading to incorrect conclusions.
For example, suppose I’m studying the relationship between exercise and weight loss. If diet is not controlled, it acts as a confounding variable because it influences both exercise habits and weight loss outcomes. To mitigate this, I must identify and control for confounding variables, either through randomization, matching, or including them as covariates in my analysis, ensuring my results are valid and unbiased.
65. Explain what a star schema is in database design.
A star schema is a type of database schema commonly used in data warehousing to organize data for easy retrieval and analysis. It consists of a central fact table containing measures (quantitative data) and multiple dimension tables that provide context to these measures. The fact table is linked to dimension tables using foreign keys, and the structure resembles a star, hence the name.
In practice, I use a star schema when I need to perform OLAP (Online Analytical Processing) queries, such as summarizing sales data by time, product, or location. The star schema’s simplicity makes it efficient for querying large datasets, as it enables quick aggregation and retrieval of data, making it ideal for business intelligence and reporting tasks.
66. When should an algorithm be updated, and why?
I update an algorithm when its performance starts to decline, often indicated by a drop in accuracy or an increase in errors. This can occur due to data drift, where the underlying data distribution changes over time, making the model’s predictions less relevant. For instance, in a financial forecasting model, economic shifts may render the model outdated.
Another scenario is when I acquire new data that wasn’t available during training. Incorporating this data can improve the algorithm’s accuracy and adaptability to current trends. Regularly updating the algorithm ensures it remains relevant, accurate, and effective in making predictions, especially in dynamic environments where data constantly evolves.
67. What are eigenvalues and eigenvectors, and why are they important in data science?
Eigenvalues and eigenvectors are concepts from linear algebra that play a crucial role in data science, especially in dimensionality reduction techniques like Principal Component Analysis (PCA). An eigenvector represents the direction of a data transformation, while the eigenvalue indicates the magnitude or strength of that transformation.
In PCA, I use eigenvectors to identify the most important features (principal components) in high-dimensional data, and eigenvalues tell me the variance explained by each component. This process allows me to reduce the dataset’s dimensionality, retaining only the most informative features, which enhances model efficiency and performance.
68. Why is resampling performed, and in which scenarios is it useful?
I perform resampling to generate additional samples from an existing dataset, especially when dealing with imbalanced classes or limited data. It helps in creating training data that is more representative of the problem at hand. Two common resampling techniques are oversampling (duplicating minority class samples) and undersampling (removing majority class samples).
Resampling is useful in scenarios where my model might be biased towards the majority class, such as in fraud detection or medical diagnosis, where positive cases are rare. By balancing the classes, I improve the model’s ability to learn patterns from all categories, leading to better performance in detecting minority class instances.
69. What is selection bias, and how can it impact your analysis?
Selection bias occurs when the data sample I analyze is not representative of the population, leading to inaccurate or skewed results. This bias arises when certain groups are more likely to be included in the sample than others, either due to sampling methods or data collection techniques.
For example, if I conduct a survey about exercise habits but only include gym members, my sample is biased, as it doesn’t reflect people who don’t exercise regularly. This bias can distort my analysis, resulting in incorrect conclusions. To minimize selection bias, I ensure random and diverse sampling techniques, ensuring my data accurately represents the population.
70. What types of biases can occur during sampling?
Several types of biases can occur during sampling, impacting the validity of my analysis. These include:
- Selection Bias: As previously mentioned, this occurs when the sample isn’t representative of the population.
- Survivorship Bias: Focusing only on surviving examples while ignoring those that failed or dropped out, leading to skewed results.
- Response Bias: When participants provide inaccurate or false responses, often due to the phrasing of questions or social desirability.
- Sampling Bias: When certain members of the population are more likely to be included due to the sampling method.
- Non-response Bias: When certain individuals do not respond, potentially differing significantly from those who do.
Understanding these biases helps me design sampling methods that minimize their impact, ensuring more accurate and reliable insights.
71. What is survivorship bias, and how can it distort findings?
Survivorship bias occurs when I focus only on the observations or data points that have “survived” a particular process, while ignoring those that didn’t. This leads to a skewed perspective, as the missing data can provide critical insights that would otherwise change my conclusions. For example, if I analyze only the successful startups, I might conclude that certain business strategies are foolproof, but I’m ignoring the countless failed startups that followed the same strategies.
Survivorship bias can distort findings because it gives an overly optimistic view of success, leading to incorrect assumptions about what works. To avoid this, I always make sure to include data from both successes and failures, providing a more balanced and accurate analysis.
72. How is a random forest constructed, and what are its advantages?
A Random Forest is constructed by combining multiple decision trees to form an ensemble model. Each tree is trained on a random subset of the data and features, and then they collectively make predictions. For classification tasks, I take the majority vote from all trees, while for regression tasks, I average their predictions. The randomness in data selection and feature usage makes each tree slightly different, reducing overfitting.
The advantages of a random forest include its ability to handle high-dimensional data, robustness against overfitting, and the ability to handle missing values. It’s also versatile, as it can be used for both classification and regression tasks, making it one of my go-to algorithms for complex problems.
73. What is the bias-variance trade-off, and why is it crucial in machine learning?
The bias-variance trade-off is a fundamental concept in machine learning that describes the balance between a model’s ability to generalize to new data and its accuracy on training data. Bias refers to the error introduced by assuming a simplified model, leading to underfitting, while variance refers to the model’s sensitivity to fluctuations in the training data, causing overfitting.
A model with high bias ignores data patterns, resulting in poor performance, while a model with high variance captures noise and fails to generalize. Finding the right balance is crucial for building an optimal model that performs well on both training and test data. I always adjust model complexity and use techniques like cross-validation to manage this trade-off.
74. Explain Markov chains and provide an example of their application.
A Markov chain is a mathematical model that describes a sequence of events where the probability of transitioning from one state to another depends only on the current state, not on previous states. This is known as the Markov property. Markov chains are widely used for modeling systems that exhibit memoryless behavior.
An example of their application is in weather prediction. If today is rainy, the probability of tomorrow being rainy or sunny depends only on today’s weather, not the weather of previous days. I’ve also seen Markov chains used in natural language processing to model sequences of words and predict the next word based on the current word.
75. Why is R widely used for data visualization in Data Science?
R is widely used for data visualization because it offers a range of powerful libraries like ggplot2, lattice, and plotly that make it easy to create complex, high-quality visualizations. These libraries provide extensive customization options, allowing me to fine-tune my plots to effectively communicate insights.
Moreover, R integrates seamlessly with statistical analysis, making it easy for me to create visualizations directly from data analysis workflows. Its ability to handle large datasets, produce publication-ready graphics, and the ease of creating interactive visualizations make R a preferred tool for data scientists focused on statistical analysis and visualization.
76. What are the differences between a box plot and a histogram, and when would you use each?
A box plot visually represents the distribution, median, and quartiles of a dataset, along with identifying outliers. It provides a summary of the data’s range, showing how the data is spread across different quartiles. I often use box plots when I want to compare the distributions of multiple groups side by side, as it quickly highlights differences in medians and variability.
A histogram, on the other hand, shows the frequency distribution of a single variable by dividing data into bins and displaying how many observations fall into each bin. It’s useful when I need to understand the shape of the data distribution, such as identifying whether it’s skewed or normally distributed. In summary, I use box plots for comparing distributions and identifying outliers, while histograms help me understand the overall distribution of a single variable.
77. What does NLP (Natural Language Processing) stand for, and what are its applications?
Natural Language Processing (NLP) is a field of artificial intelligence that focuses on enabling computers to understand, interpret, and generate human language. NLP combines linguistics, computer science, and machine learning to process and analyze large volumes of natural language data.
Applications of NLP are diverse and include sentiment analysis for understanding opinions in social media, chatbots for customer service automation, machine translation (e.g., Google Translate), speech recognition (e.g., virtual assistants like Siri or Alexa), and text summarization. I often use NLP techniques in projects involving text data, allowing me to extract meaningful insights from unstructured information.
78. How do error and residual error differ in data analysis?
Error refers to the difference between the actual value and the predicted value for the entire population or true values. It represents the overall inaccuracy of a model in predicting outcomes. In contrast, a residual error is the difference between the observed value and the predicted value for an individual sample in the dataset. It’s the part of the error specific to each observation.
In practice, I use residuals to analyze the performance of a model on the training data, and by plotting residuals, I can identify patterns or inconsistencies that might indicate model inadequacies. While error is a measure of model performance on a broader scale, residual error gives me insights into how well the model fits individual data points.
79. What is the difference between normalization and standardization?
Normalization and standardization are techniques used to scale data. Normalization transforms data to a range between 0 and 1, making it useful when I want to ensure all features contribute equally to the model. I use the formula:

Standardization, on the other hand, transforms data to have a mean of 0 and a standard deviation of 1. It’s useful when I need the data to follow a normal distribution, especially for algorithms sensitive to feature scaling, such as SVMs or KNN. I use the formula:

Choosing between normalization and standardization depends on the dataset and the specific machine learning model I’m working with.
80. How do point estimates differ from confidence intervals?
A point estimate is a single value used to estimate a population parameter, such as the mean or proportion. It provides a specific, concise estimate but doesn’t convey the uncertainty associated with the estimate. For instance, the sample mean is a point estimate of the population mean.
In contrast, a confidence interval provides a range of values within which the population parameter is likely to fall, along with a level of confidence (e.g., 95%). It accounts for sample variability and offers more information about the precision of the estimate. While point estimates give me a quick snapshot, confidence intervals provide a more comprehensive view of the potential accuracy of the estimate.
81. Which machine learning algorithm is your favorite, and why?
My favorite machine learning algorithm is the Random Forest. I appreciate its versatility and robustness, as it performs well on both classification and regression tasks. It’s an ensemble method that builds multiple decision trees and combines their predictions, which helps reduce overfitting and improves model accuracy. The randomness introduced in feature selection and data sampling makes it less prone to noise, resulting in a more generalized model.
Additionally, the Random Forest algorithm is highly interpretable compared to other complex models, and I can extract feature importance scores, which helps me understand which features are most influential in making predictions. This transparency and reliability make Random Forest my go-to algorithm for many projects, especially when working with complex datasets.
82. What is the most important skill that makes a good data scientist, in your opinion?
In my opinion, the most important skill for a good data scientist is problem-solving. Data science involves much more than just technical knowledge; it requires the ability to analyze complex problems, break them down into manageable parts, and apply the right techniques to find solutions. Being able to think critically and creatively is essential for tackling real-world challenges where data is messy, incomplete, or ambiguous.
Moreover, strong communication skills are equally important. As a data scientist, I must translate complex findings into actionable insights that non-technical stakeholders can understand. This combination of problem-solving ability and effective communication allows me to bridge the gap between data analysis and business decision-making, making it a crucial skill in the field.
83. Why do you think Data Science has gained so much popularity today?
Data Science has gained immense popularity today because of the explosion of data generated by digital activities, such as social media, e-commerce, and IoT devices. Organizations have realized that data is a valuable asset that, when analyzed effectively, can lead to data-driven decision-making, improved operational efficiency, and a deeper understanding of customers. As a result, the demand for data scientists who can extract actionable insights from this vast amount of data has surged.
Moreover, advancements in machine learning algorithms and the availability of computational power have made it easier to analyze complex datasets and build predictive models. Data Science has become a vital tool for businesses looking to stay competitive, innovate, and respond quickly to changing market trends.
84. What was the most challenging data science project you worked on?
One of the most challenging data science projects I worked on involved predicting customer churn for a subscription-based service. The dataset was highly imbalanced, with only a small percentage of customers actually churning, making it difficult for traditional models to identify the at-risk customers accurately. Additionally, there were multiple features with missing values and inconsistent data, which required extensive data preprocessing.
To address this challenge, I used techniques like SMOTE (Synthetic Minority Over-sampling Technique) to handle the class imbalance and experimented with different models, such as Random Forests and Gradient Boosting Machines. I also implemented cross-validation to avoid overfitting. After refining the model, I was able to achieve a significant improvement in recall, which helped the company identify high-risk customers more effectively and implement targeted retention strategies.
85. How do you prefer to work on a project: individually, in a small team, or a large team?
I prefer working in a small team because it offers a balance between collaboration and autonomy. In a small team, there’s enough diversity in skills and perspectives to tackle complex problems effectively, but it’s also easier to communicate, coordinate tasks, and adapt quickly to changes. I find that I can contribute more meaningfully and have a greater impact on the project’s success in this environment.
Working individually can be rewarding for tasks that require deep focus, but I believe collaboration often leads to better solutions. On the other hand, large teams can sometimes be challenging due to communication barriers and slower decision-making processes. In small teams, I enjoy sharing ideas, learning from others, and leveraging each member’s strengths to achieve our goals efficiently.
86. What are your top five predictions for the next 10 years based on your industry experience?
Based on my industry experience, my top five predictions for the next 10 years are:
- Increased Automation: Routine tasks will be increasingly automated using AI and machine learning, freeing up human talent for more strategic roles.
- AI Integration in Everyday Life: AI will become even more embedded in daily activities, from smart home devices to personalized health care recommendations.
- Data Privacy and Ethics: With growing concerns about data privacy, stricter regulations and ethical frameworks will emerge, requiring data scientists to prioritize responsible data handling.
- Widespread Use of Quantum Computing: Quantum computing will revolutionize data processing and machine learning, enabling us to solve complex problems currently beyond our reach.
- Hyper-Personalization: Companies will leverage data and AI to create hyper-personalized experiences, making recommendations, products, and services more tailored to individual preferences.
These predictions highlight the continued importance of data-driven insights and the evolving role of data science in various industries.
87. What unique skills do you bring to a team as a data scientist?
As a data scientist, I bring a unique blend of technical expertise and business acumen to the team. My strong foundation in machine learning, statistics, and programming allows me to build robust models and perform advanced data analysis. At the same time, I have a deep understanding of business objectives, which helps me translate data insights into actionable strategies that align with organizational goals.
Additionally, I have excellent communication skills, enabling me to convey complex data findings in a clear and accessible way to non-technical stakeholders. This combination of technical proficiency, business understanding, and effective communication makes me a valuable asset to any team, ensuring that data-driven insights lead to impactful decisions.
88. Did you always work in Data Science, or did you transition from another field? If so, how did you upgrade your skills?
I didn’t start my career in Data Science; I transitioned from a background in software development. My experience in programming gave me a solid foundation, but I realized the potential of data-driven decision-making and became fascinated by data science. To upgrade my skills, I took several online courses on platforms like Coursera and Udemy, focusing on machine learning, statistics, and data analysis.
I also completed hands-on projects, participated in Kaggle competitions, and attended workshops and conferences to stay updated with the latest trends. This continuous learning approach allowed me to develop the necessary skills to succeed as a data scientist, combining my software development experience with data science techniques.
89. How would you evaluate if a random dataset is suitable for a specific business need?
To evaluate if a random dataset is suitable for a specific business need, I first assess whether the dataset contains the relevant features and target variables needed to address the problem. I check for the quality of data by examining missing values, outliers, and inconsistencies. A dataset that lacks critical information or has poor data quality might not be suitable.
Next, I analyze the sample size and representativeness of the data to ensure it accurately reflects the broader population. If the dataset is too small or biased, the insights drawn may not generalize well to real-world scenarios. By validating these aspects, I ensure that the dataset can effectively support the business objective.
90. If you could pick a different career other than Data Science, what would it be and why?
If I could pick a different career, I would choose to be a teacher or educator. I have always enjoyed sharing knowledge and helping others understand complex topics, and teaching offers a platform to inspire and guide others in their learning journey. The opportunity to break down challenging concepts and see the “aha” moments when students grasp new ideas is incredibly rewarding.
Teaching would also allow me to stay engaged with learning, as I believe that the best way to master a subject is to teach it. This passion for knowledge-sharing is one of the reasons I enjoy mentoring junior data scientists and contributing to community forums.
91. How do you adapt to the rapidly changing technologies in Data Science?
To adapt to the rapidly changing technologies in Data Science, I adopt a mindset of continuous learning. I regularly take online courses, attend webinars, and participate in workshops to stay updated with the latest tools, techniques, and trends. I also read research papers, blogs, and articles from industry leaders to gain insights into emerging methods and technologies.
Another way I stay current is by engaging in hands-on projects and Kaggle competitions, which allow me to apply new concepts in real-world scenarios. By actively experimenting with different tools and algorithms, I ensure that my skills remain relevant and up-to-date. Networking with other data scientists through conferences and communities also helps me learn from their experiences and keeps me informed about industry advancements.
92. Have you ever faced a conflict with colleagues over project strategies? How did you resolve it?
Yes, I have faced conflicts with colleagues over project strategies, especially when we had different opinions on the best approach to solving a problem. In one instance, I preferred a machine learning model that offered interpretability, while my colleague advocated for a more complex but less interpretable model. To resolve the conflict, I initiated an open discussion where we analyzed the pros and cons of each approach, considering the project’s objectives and stakeholder requirements.
By presenting evidence and focusing on the data, we agreed to test both models and evaluate their performance based on key metrics. This data-driven approach allowed us to make an informed decision, and we ultimately chose the model that best aligned with the project goals. The experience taught me the importance of communication, collaboration, and staying open-minded when resolving conflicts.
93. Can you break down a machine learning algorithm you recently used in a project?
Recently, I used the Gradient Boosting algorithm in a project to predict customer churn for a telecommunications company. Gradient Boosting is an ensemble technique that builds multiple weak learners (typically decision trees) sequentially, with each tree correcting the errors of the previous one. It minimizes the loss function by combining these trees to create a strong predictive model.
I started by training the first tree using the original dataset, then used the residual errors to train the next tree, iteratively improving the model’s accuracy. I tuned hyperparameters such as the learning rate, number of trees, and maximum depth to optimize performance. This approach allowed me to build a model with high accuracy and precision, helping the company identify customers at risk of churning and take proactive measures.
94. What tools did you use in your last data science project, and why did you choose them?
In my last data science project, I used several tools, including:
- Python: For data cleaning, preprocessing, and building machine learning models, as it offers powerful libraries like Pandas, Scikit-learn, and NumPy.
- Jupyter Notebook: To write and execute code interactively, which made it easy to document my process and visualize data exploration.
- Tableau: For creating interactive visualizations and dashboards, making it easier to communicate findings to non-technical stakeholders.
- SQL: For querying and extracting data from the database, ensuring efficient data manipulation.
These tools provided a comprehensive suite for handling every aspect of the project, from data wrangling to model building and visualization. Their flexibility, ease of use, and strong community support made them ideal choices for my project.
95. What is your preferred strategy for cleaning a large dataset, and why?
My preferred strategy for cleaning a large dataset involves a systematic approach. First, I inspect the dataset for missing values and decide whether to impute them (using mean, median, or mode) or remove them if they are not critical. Next, I handle outliers by either capping them or using transformation techniques to reduce their impact.
I then check for inconsistencies in data types, formats, and duplicates, ensuring data is standardized and consistent. Finally, I perform feature scaling and encoding for categorical variables, preparing the dataset for machine learning. This process ensures that the data is accurate, complete, and ready for analysis, which leads to better model performance.
96. Do you contribute to any open-source projects? If so, which ones and why?
Yes, I contribute to open-source projects, primarily focusing on data science libraries like Pandas and Scikit-learn. I believe that contributing to these projects allows me to give back to the community that has provided me with valuable resources throughout my learning journey. By participating, I gain a deeper understanding of the inner workings of these tools, which enhances my skills and keeps me updated on the latest developments.
Additionally, I contribute to smaller projects on GitHub, where I help improve data analysis tools and build machine learning utilities. This experience not only helps me stay sharp technically but also allows me to collaborate with other data scientists, broadening my network and learning from their expertise.
Conclusion
Getting ready for a data science interview takes time, but it’s worth it. Focus on the main topics like coding, statistics, and problem-solving. Practice common questions to boost your confidence and give better answers.
Interviewers want to see how you think and explain your ideas clearly. With enough preparation, you can handle the questions and show your strengths. Stay positive, and you’ll do great!

