
PCA in Machine Learning: Meaning, Working, Examples & Applications
Introduction to PCA in Machine Learning
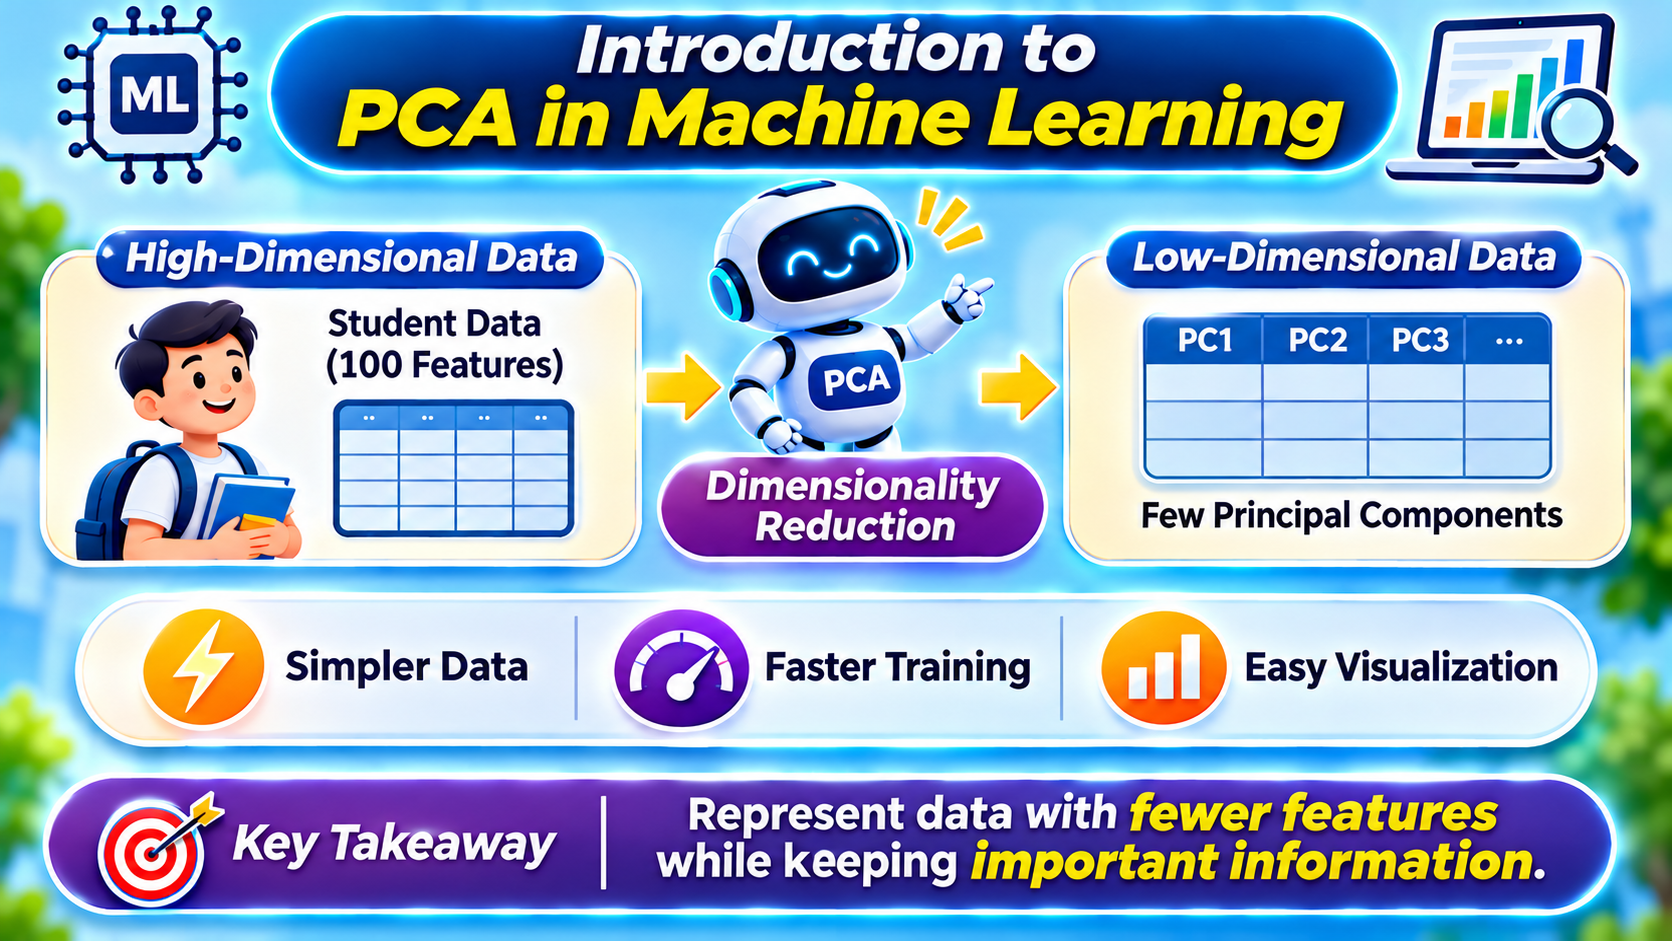
In Machine Learning, data plays an important role in building accurate and efficient models. Every dataset contains information that helps a machine learning algorithm understand patterns, identify relationships, and make predictions. However, real-world datasets often contain a large number of features. These features may include customer details, student information, financial records, product characteristics, or medical information. When a dataset contains hundreds or thousands of features, analyzing and processing the information can become challenging. This is where Principal Component Analysis, commonly known as PCA, becomes useful.
Imagine that you have a dataset containing 100 different details about students in a college. These details may include age, examination marks, attendance percentage, study hours, assignment scores, practical marks, and many other characteristics. If you want to analyze student performance using Machine Learning, do you really need to use all 100 features? Some features may contain similar information, while others may contribute very little to understanding the overall pattern. Instead of working with all the original features, we may want to represent the important information using a smaller number of features. PCA helps us achieve this by transforming the original features into a smaller set of new features called Principal Components.
PCA is an important dimensionality reduction technique used in Machine Learning and Data Science. It helps simplify complex datasets by reducing the number of dimensions while retaining as much of the important information as possible. This can make data easier to analyze, visualize, and process.
Looking for the best AI Training in Hyderabad? Learn Generative AI, Agentic AI, LLMs, RAG, and AI Agents through hands-on training, real-time projects, and expert guidance. Upgrade your skills and build a successful career in Artificial Intelligence.
What Does PCA Stand For?
PCA stands for Principal Component Analysis. It is a statistical technique used to identify important patterns and variations within a dataset. It transforms the original correlated features into a new set of uncorrelated variables called Principal Components. These components are arranged according to the amount of variation they capture from the original data.
To understand this concept, imagine that you have student information containing marks in Mathematics, Physics, Chemistry, Biology, and other subjects. Some students who perform well in Mathematics may also perform well in Physics. This means that certain features may contain related information. PCA analyzes the relationships and variations among the original features and creates new components that represent the important patterns in the dataset.
The first Principal Component captures the maximum possible variance in the data. The second Principal Component captures the maximum remaining variance while being uncorrelated with the first component. Additional components capture the remaining variance in decreasing order. By selecting only the first few components, we can represent much of the original information using fewer dimensions.
Why Is Dimensionality Reduction Important in Machine Learning?
Dimensionality refers to the number of features or variables present in a dataset. For example, if a student dataset contains age, marks, attendance, study hours, and assignment scores, it has five features. If the dataset contains 100 different student characteristics, it has 100 dimensions.
Working with a large number of dimensions can create several challenges. Processing more features may require additional computational resources and memory. Some features may contain redundant or highly correlated information, which can make the dataset more complex. Visualizing data with hundreds of dimensions is also difficult because humans generally understand visual patterns more easily in two-dimensional or three-dimensional representations.
Dimensionality reduction techniques help address these challenges by representing the dataset using fewer dimensions. PCA is one of the commonly used techniques for this purpose. It transforms the original features into a smaller number of Principal Components while attempting to preserve the maximum possible variance.
For example, imagine that a dataset contains 100 features. Instead of using all 100 original features, PCA may allow us to represent a large portion of the dataset’s variation using 10 or 15 Principal Components. The exact number depends on the dataset and how much information we want to retain. Reducing the number of dimensions can make some machine learning workflows faster and can make complex data easier to visualize.
How Does PCA Work in Machine Learning?
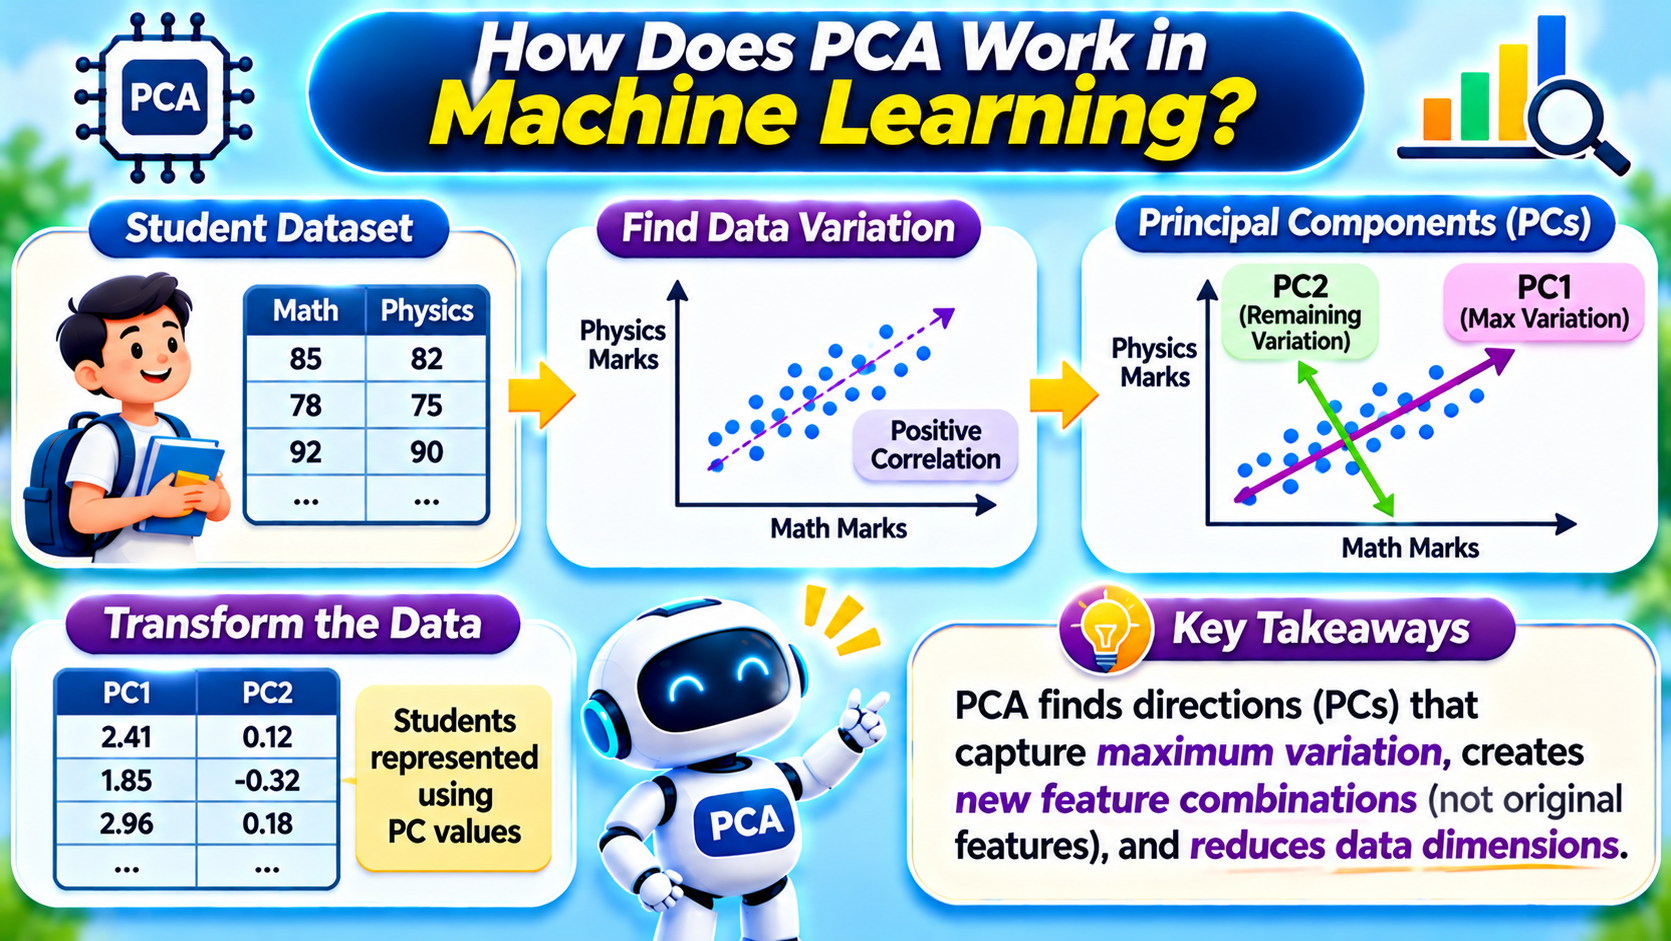
PCA works by analyzing the variation and relationships among the features in a dataset. It identifies the directions in which the data varies the most and creates new axes called Principal Components. These new components provide a different way of representing the original data.
Consider a dataset containing student examination marks in Mathematics and Physics. If students who score high marks in Mathematics also tend to score high marks in Physics, the two features may show a positive correlation. When we plot this information on a graph, the data points may form a pattern along a particular direction.
PCA identifies the direction in which the data shows the greatest variation. This direction becomes the first Principal Component. It then identifies another direction that captures the maximum remaining variation while remaining perpendicular to the first component. This becomes the second Principal Component.
The original data is then transformed into these new components. Instead of representing each student using the original Mathematics and Physics features, we can represent the student using Principal Component values. When we retain fewer components than the original number of features, the dimensionality of the dataset is reduced.
An important point to understand is that Principal Components are not simply selected original features. They are newly created combinations of the original features. Each component is calculated using a weighted combination of the original variables. These weights are known as loadings and help determine how strongly each original feature contributes to a component.
Understanding PCA with a Student Dataset Example
Let us understand PCA using a simple real-world example from a college. Imagine that a college maintains information about 1,000 students. For every student, the dataset contains 100 different features, including age, attendance, examination marks, assignment scores, study hours, practical marks, and other academic details.
The college wants to analyze student performance and identify important patterns using Machine Learning. However, working with 100 features may make the analysis more complex. Some features may provide similar information, and certain features may not contribute significantly to the overall variation in the dataset.
Now, imagine applying PCA to this student dataset. PCA analyzes the relationships among the 100 original features and identifies the directions that capture the most variation. It transforms the original dataset into a new set of Principal Components. If the first 10 components capture a sufficiently large proportion of the total variance, the college may choose to use those 10 components instead of all 100 original features for a particular analysis.
This means that the dataset has been reduced from 100 dimensions to 10 dimensions while retaining much of the variation present in the original data. However, the new components may combine information from several original features. They should not automatically be interpreted as individual characteristics such as attendance or examination marks.
This example shows how PCA can help simplify high-dimensional data and make it easier to work with in Machine Learning applications.
What Are Principal Components?
Principal Components are the new features created by PCA from the original dataset. They represent the directions in which the data contains the greatest variation. Instead of using the original variables directly, PCA creates a new coordinate system that captures the important patterns in the data.
The first Principal Component, known as PC1, captures the maximum possible variance in the dataset. The second Principal Component, known as PC2, captures the maximum remaining variance while being orthogonal to the first component. The third Principal Component captures the next highest amount of remaining variance, and this process continues for the other components.
For example, if a dataset contains 20 original features, PCA can generate up to 20 Principal Components when the data has full rank. However, we do not necessarily need to use all the components. We can select a smaller number based on how much variance we want to preserve.
The main purpose of selecting fewer Principal Components is to reduce the dimensionality of the dataset without losing too much important information. This is why understanding Principal Components is essential when learning PCA.
How Does PCA Help Reduce Data Dimensions?
Dimensionality reduction is one of the main applications of PCA. It helps transform a dataset containing many original features into a smaller set of Principal Components. This can simplify the dataset while preserving a significant amount of its variation.
Imagine that you have a dataset containing 100 features. Processing all 100 features may require more computational resources, depending on the algorithm and dataset size. By applying PCA, you may be able to reduce the dataset to 10 Principal Components that capture most of the original variance.
However, PCA does not guarantee that every important detail will be preserved. Some information is lost when we remove components, particularly when those components contain a portion of the original variance. Therefore, choosing the appropriate number of Principal Components is important.
PCA is commonly used for data visualization, exploratory data analysis, noise reduction in suitable situations, and preparing high-dimensional data for certain machine learning algorithms. Its usefulness depends on the structure of the dataset and the requirements of the particular problem.
What Is Explained Variance in PCA?
Explained variance is an important concept in PCA. It tells us how much of the total variation in the original dataset is captured by each Principal Component. Since the first Principal Component captures the maximum possible variance, it generally has the highest explained variance. The following components capture progressively smaller amounts of the remaining variance.
For example, imagine that the first Principal Component captures 50% of the total variance, the second captures 25%, and the third captures 15%. Together, these three components explain 90% of the total variance in the dataset. If we retain these three components, we preserve 90% of the original variance according to PCA.
The cumulative explained variance helps us decide how many Principal Components to retain. A data scientist may examine the cumulative variance and select an appropriate number of components based on the requirements of the application. There is no single percentage that is suitable for every dataset. The decision depends on the balance between reducing dimensions and preserving useful information.
PCA and Feature Selection: Are They the Same?
PCA and Feature Selection are related to simplifying datasets, but they are not the same technique. Feature Selection identifies and retains a subset of the original features based on their relevance to a particular problem. For example, from 100 original features, a feature selection method may retain only 15 important features and discard the remaining ones. The selected features still represent the original variables.
PCA works differently. Instead of selecting a subset of the original features, it transforms the original variables into new combinations called Principal Components. These components may contain information from several original features. Therefore, the resulting components may not have the same direct meaning as the original variables.
For example, if a student dataset contains Mathematics marks, Physics marks, Chemistry marks, and study hours, feature selection may retain Mathematics marks and study hours as important original features. PCA may instead create a new Principal Component by combining information from several of these variables. Understanding this difference is important when deciding which dimensionality reduction or feature selection technique is appropriate for a Machine Learning problem.
Join our AI Online Training program and learn the latest AI technologies from industry experts. Gain practical knowledge of Generative AI, Agentic AI, Prompt Engineering, LLMs, and AI Agents through live interactive classes and real-time projects.
Real-Time Applications of PCA in Machine Learning
PCA is used in different fields where datasets contain a large number of features. In image processing, for example, an image may contain thousands or millions of pixel values. PCA can help represent patterns in image data using fewer dimensions. This can be useful for certain image analysis and recognition workflows. However, applying PCA does not automatically reduce the actual image file size because PCA transforms the representation of the data rather than directly compressing the original image file.
In the healthcare industry, datasets may contain many measurements related to patients, such as age, blood pressure, cholesterol levels, test results, and other medical indicators. PCA can help researchers explore patterns and relationships among these variables by reducing the number of dimensions. The resulting components may make it easier to visualize complex datasets and identify broad patterns.
In finance, organizations work with large datasets containing information about stock prices, market indicators, investment performance, and economic variables. PCA can help analyze relationships among these variables and identify major patterns in the data. It may also be used in exploratory analysis and certain risk analysis workflows.
In customer analytics, companies may collect information about customer purchases, spending habits, website activity, product preferences, and interactions. PCA can help transform large customer datasets into fewer dimensions, making it easier to explore customer patterns and prepare data for certain analytical applications.
These examples demonstrate how PCA can support data analysis across different industries. However, PCA is not suitable for every problem, and its effectiveness depends on the nature and quality of the data.
Advantages of PCA in Machine Learning
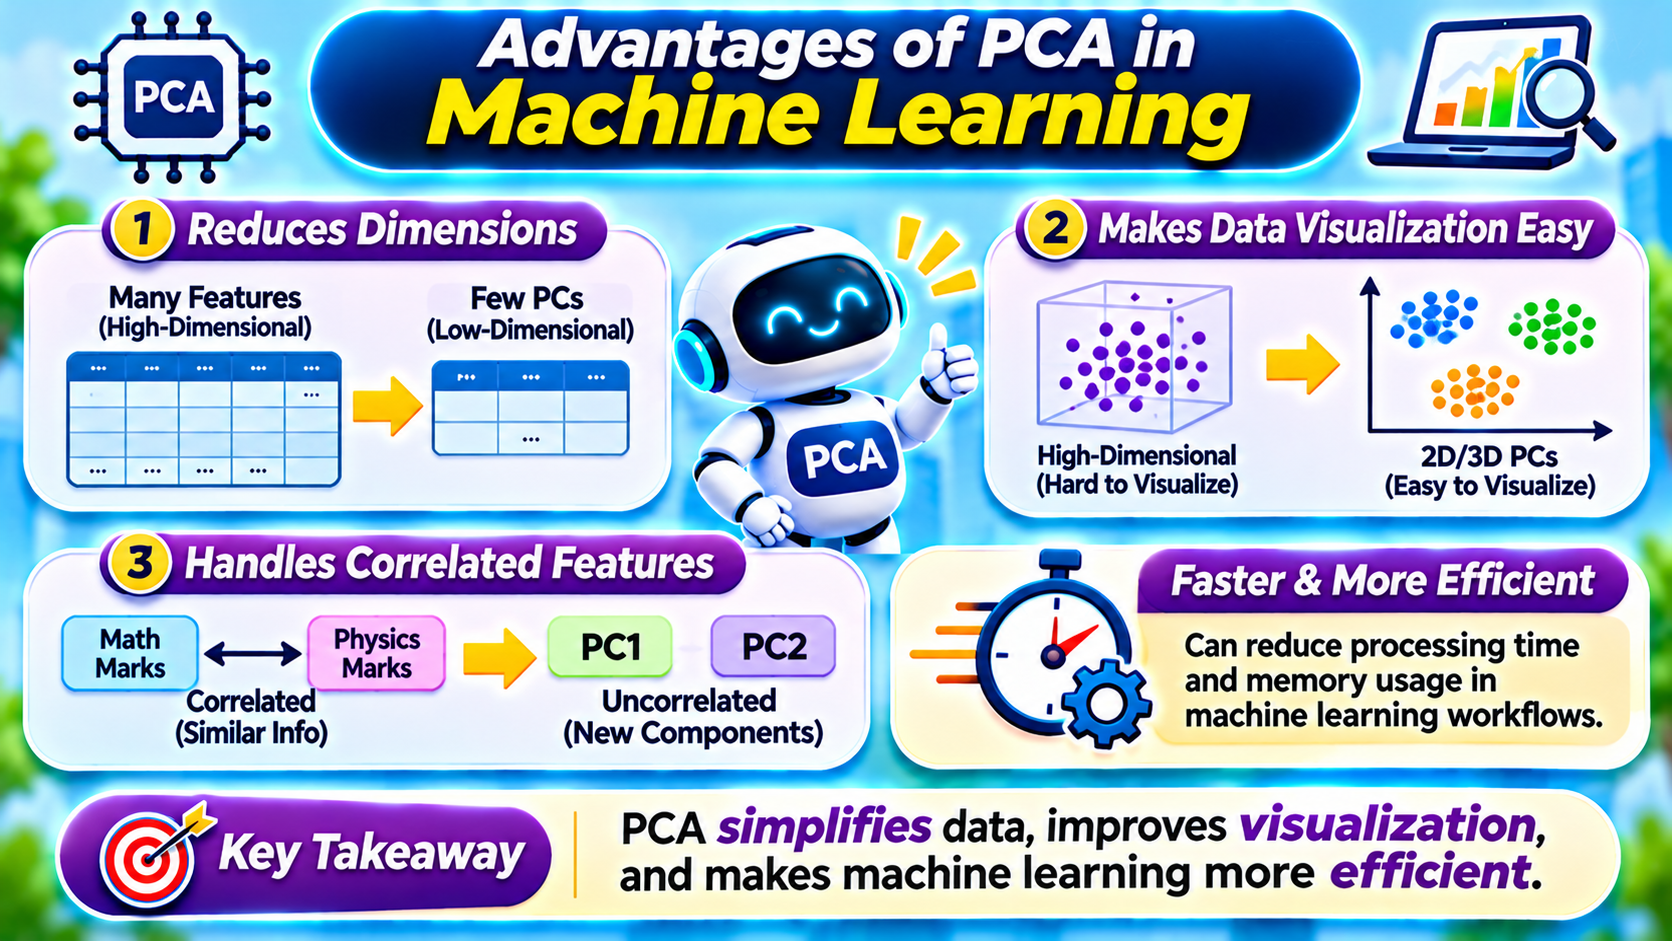
One of the main advantages of PCA is that it reduces the number of dimensions in a dataset while attempting to preserve as much variance as possible. This can simplify complex datasets and make them easier to analyze. When a machine learning workflow uses fewer dimensions, certain algorithms may require less processing time and memory, although the actual improvement depends on the algorithm, dataset, and implementation.
Another advantage is that PCA can help with data visualization. High-dimensional datasets are difficult to visualize directly. By transforming the data into two or three Principal Components, data scientists can create visual representations that help them explore patterns, clusters, and relationships. PCA can also help reduce the impact of some low-variance directions, which may be useful in certain noise reduction applications.
PCA is particularly useful when many original features are correlated. It creates new components that are uncorrelated with one another in the transformed dataset. This can help simplify certain analytical workflows and make it easier to work with datasets containing redundant information.
Limitations of PCA
Although PCA is a powerful dimensionality reduction technique, it also has certain limitations. One important limitation is that PCA may cause information loss when we remove some of the Principal Components. The components with lower variance may still contain useful information for a particular prediction task. Therefore, retaining only the components that explain the most variance does not always guarantee the best predictive performance.
Another limitation is that Principal Components can be difficult to interpret. Since each component is a combination of multiple original features, understanding what a component represents may require examining its loadings. This can make PCA less interpretable than working directly with the original variables.
PCA is also sensitive to the scale of the features. For example, if one feature contains values in thousands and another contains values between zero and one, the feature with larger numerical values may dominate the variance calculation. Therefore, standardizing or scaling features is often important before applying PCA, depending on the dataset.
PCA is a linear technique, meaning it identifies linear directions of maximum variance. If the important patterns in a dataset are highly nonlinear, PCA may not capture them effectively. In such situations, other dimensionality reduction techniques may be more suitable.
Conclusion: Why Is PCA Important in Machine Learning?
Principal Component Analysis is an important dimensionality reduction technique in Machine Learning and Data Science. It helps transform high-dimensional datasets into a smaller number of new features called Principal Components while preserving as much of the original data’s variance as possible.
When a dataset contains many features, PCA can help simplify the information, reduce computational requirements in certain workflows, and make complex data easier to visualize. It is useful in areas such as image processing, healthcare analytics, financial analysis, and customer data analysis.
However, PCA does not preserve every detail of the original dataset, and some information may be lost when fewer components are retained. It also creates new combinations of the original features rather than simply selecting the most important original variables. Therefore, understanding explained variance, feature scaling, and the limitations of PCA is important when applying this technique.
In simple words, PCA helps us represent high-dimensional data using fewer dimensions while retaining as much important information as possible. Learning PCA provides a strong foundation for understanding dimensionality reduction and other important Machine Learning concepts.
Start Learning Machine Learning Today – Understand PCA, Explore Data Science Concepts, and Build Your AI Skills!
Read also: How Do AI Agents Communicate with Each Other? Understanding Multi-Agent Communication

